Free I Don't Think Lindley's Paradox Supports P-circling 2025
As usual I’d like to preface all this that I write these blogposts as attempts to make sense of a subject for my own sake. I am not an expert here and it is likely I am confused about some details. On the other hand, I think “confused” discourse can also be productive to read and participate in. Being confused is just the first step towards being unconfused, to paraphrase Jake The Dog.
100 years ago this year Fisher arbitrarily suggested using p < 0.05 as a cut-off for “significant” and ever since we’ve just gone along with it. “Why is it 0.05?” people have critically asked for one hundred years. Unfortunately “arbitrariness”, as a critique, is only effective if you are able to suggest less a arbitrary value, and despite many efforts to change this the convention has remained.
Before we get into it let’s briefly try to remind ourselves what p-values are even supposed to do. (This will be a brief summary, if you want to learn this for real I recommend reading Daniël Lakens free online textbook, which all this borrows heavily from.)
As far as I’ve understood, Fishers idea about p-values was supplanted by the more rigorous (in terms of statistical philosophy) Neyman-Pearson framework. It is within this framework we find the familiar type 1 and type 2 error rates. Probability is viewed as being about outcomes in a hypothetical scenario where a procedure is repeated many times. You’re actually supposed to set the \(\alpha\) at a level that’s justifiable based on what null hypothesis you’re testing. As far as I’ve understood no one has ever done so, except that one time physicists at CERN decided they wanted to be really sure they didn’t incorrectly claim they found the Higgs boson.1 Instead everyone just uses the arbitrary convention of \(\alpha = 0.05\).
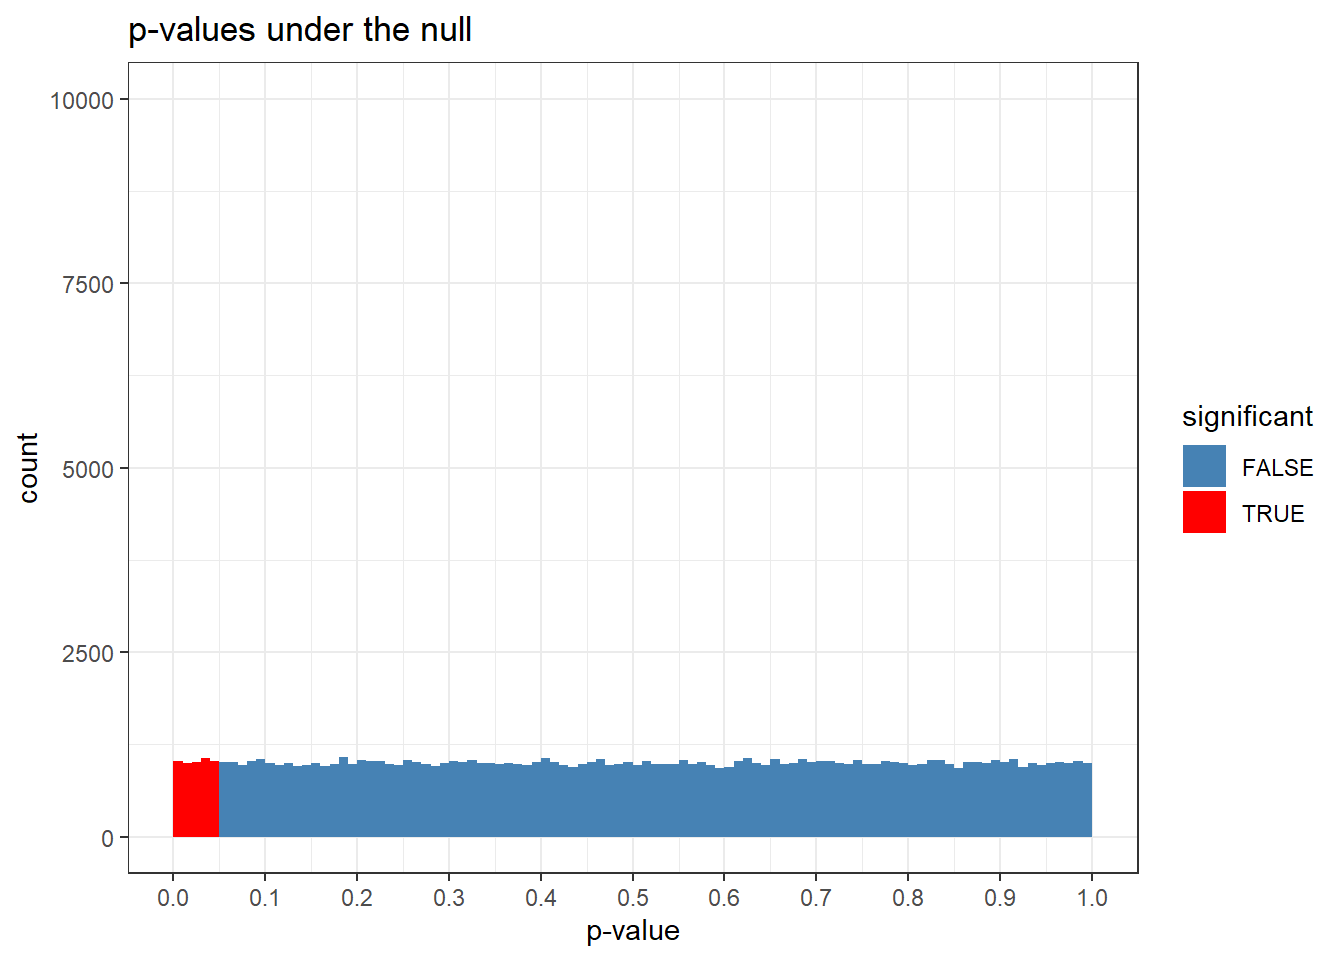
If you assume that the null is true, the p-value distribution is uniform. Let’s do the exercise of generating a hundred thousand t-tests between two groups, n = 100 per group, where there is no mean difference. Then we’ll look at the p-values.
I remember this blew my mind when I fist saw it. I don’t think I was surprised exactly; it just made it all click. This flatness is what p-values are all about, man! The p-value distribution is uniform under the null! Yes! It is this property of the distribution that gives meaning to the type 1 error rate.
NP-frequentism is then based on committing to an alpha threshold beforehand and then exclaim “significant!” iff the p-value lands below it.2
No! If the null is
Source: HackerNews
