Tools

Tools: Update: Why status page aggregators matter for engineering teams
The bookmark farm problem
Incidents are correlation problems
Why "just subscribe by email" falls short
What good aggregation implies
Examples you actually run on (each with its own status story)
Where Exemplar SRE fits
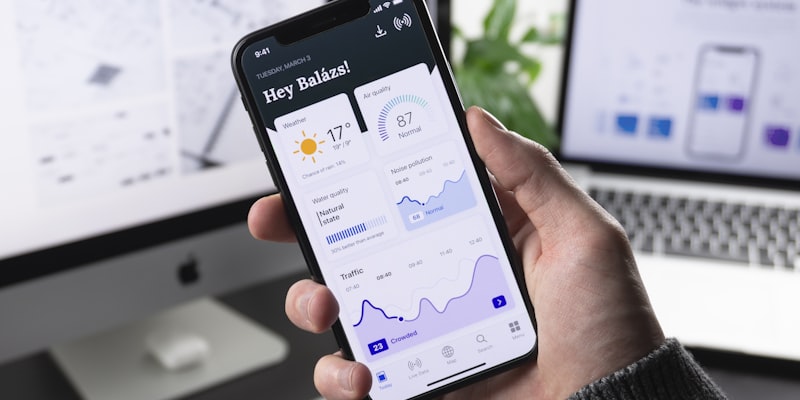
Bottom line Every serious product leans on a handful of clouds, data stores, identity providers, payment rails, and edge networks. In practice, a typical engineering team depends on more than five cloud vendors, SaaS tools, and managed services—often many more—and each publishes its own status surface. Those pages are often well designed but rarely aligned with one another. The gap is not whether they exist; it is whether your team can see them as a system when minutes matter. In calm weather, engineers maintain mental maps: which provider backs auth, which queue sits behind that worker, which CDN fronts the app. Under pressure, those maps blur. Someone opens six tabs, skims green badges, and still cannot tell whether an upstream degradation explains the spike in errors—or whether the team is chasing ghosts while a vendor silently warms up a postmortem draft elsewhere. A status page aggregator is not a replacement for your observability stack. It is a coordination layer: one place to read external truth alongside the signals you already own, so "is it us or them?" does not depend on who remembers which subdomain hosts the CDN incident blog. Most customer-visible outages are multi-causal: your code, your config, a regional issue, a partner API, or some combination. Effective response means narrowing the cone of uncertainty fast. If third-party health lives in a dozen silos, you pay a tax in latency, missed links, and duplicated communication—people asking the same question in parallel because there is no shared picture. Aggregation buys time where SLIs cannot: it surfaces vendor maintenance windows, partial outages, and acknowledged degradations in the same operational rhythm as your internal incidents. That is especially valuable for platform and SRE teams who are accountable for the whole journey, not a single service boundary. Email and RSS alerts help individuals; they rarely give a war room a live, comparable view. Threading vendor messages into a coherent timeline still takes work—and during a sev, nobody wants to reconstruct state from forwarded messages. Teams need something closer to a *shared dashboard * for dependencies: scannable, current, and honest about what is still unknown. Mature engineering orgs look for a few properties: breadth (the vendors you actually run on), freshness (feeds that update without manual polling), and context (how external state relates to your components and incidents). The goal is not to chase every SaaS on the internet—it is to cover the dependencies whose failures look like yours on the outside. Once you count clouds, data, CI/CD, comms, IDP, and observability, that "more than five" bar is easy to clear—so the stack strings together more vendor status pages than most runbooks admit. A few patterns we see in the wild—none of these replace your metrics, but any of them can look like "our app is broken" when they hiccup: The point is not to name-check logos—it is that these systems have different owners, different incident cadences, and different status pages. Aggregation is how you stop treating each one as a solo investigation. We treat third-party status as part of the same reliability surface as your probes, incidents, and customer-visible boards—so operators are not choosing between "our stack" and "the rest of the world" in separate tools. Status page aggregators exist because distributed systems are distributed across companies too. Giving engineering teams a unified read on that outer layer is not a nice-to-have—it is part of running incidents, protecting trust, and keeping small problems from becoming reputation events. Opinion piece—general discussion only. Subscribe to our Newsletter Follow us on Linkedin Checkout Exemplar Dev Platform Templates let you quickly answer FAQs or store snippets for re-use. as well , this person and/or - Supabase — hosted Postgres, auth, and realtime. A regional issue or elevated latency on their side often shows up as elevated 5xxs, flaky logins, or websocket churn in your app long before your dashboards tell you it was upstream.
- Docker Hub and container registries — CI pipelines and Kubernetes image pulls depend on registry availability, rate limits, and auth. When docker pull or cluster pulls fail, every team hits the same wall; the signal belongs next to your deploy and node health, not in a forgotten bookmark.- GitHub — Actions minutes, Packages, and the API gate merges, releases, and artifact flows. A partial outage there can stall shipping even when production metrics look fine.- Language and package ecosystems — npm, PyPI, and similar registries sit in the path of every clean install in CI. A degradation there surfaces as flaky builds and "works on my machine" drift, not as a line item in APM.